
Better than BI: Using dashboards across applications
Visualizing large amounts of data with just a few clicks – this requires intelligent solutions. Our modern dashboards support and simplify your analyses and reporting. Complex data and processes are bundled behind a clean user interface.
Many of our products are integrated into our customers’ processes. The underlying volumes of stored data are correspondingly large – as is the need to structure them in a targeted manner and to visualize them clearly. Based on the demanding Trascue requirements, we have developed a React-based framework, which can prospectively be transferred into a universally applicable frontend technology and integrated into the basic concepts of other products such as LaRA or GeoNAM. Behind the scenes, each dashboard view offers specific configuration files which are developed in close consultation with customers. Once the configuration mechanism has been implemented in the background, the data can be visualized in a targeted manner. One form of display is the intuitively operable tile structure. Necessary authorization concepts can be adopted from the core product.
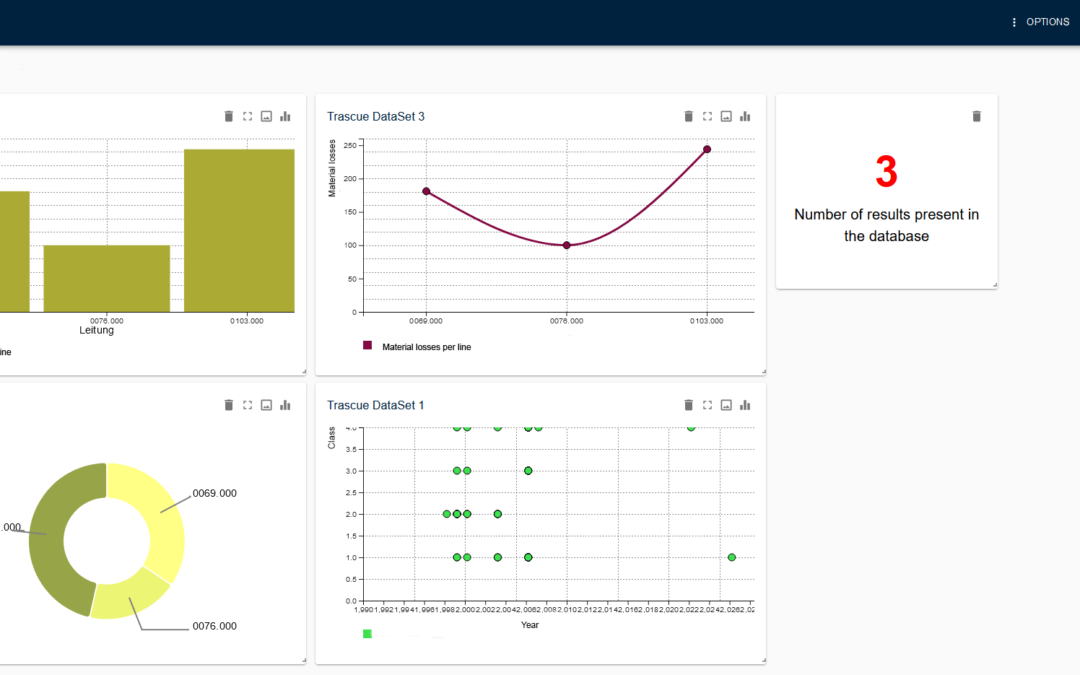
In another use case, the dashboard generates list and chart views. These can be freely combined and compared by the user, scaled, and exported for presentations. Smartphone or laptop – the Responsive Design adapts to all mobile, Internet-enabled devices.
In the future, even more movement will come into play. Displaying and updating data in real time are at the top of our to-do list. In the future, dashboards will be integrated as a module in all GEOMAGIC product developments.